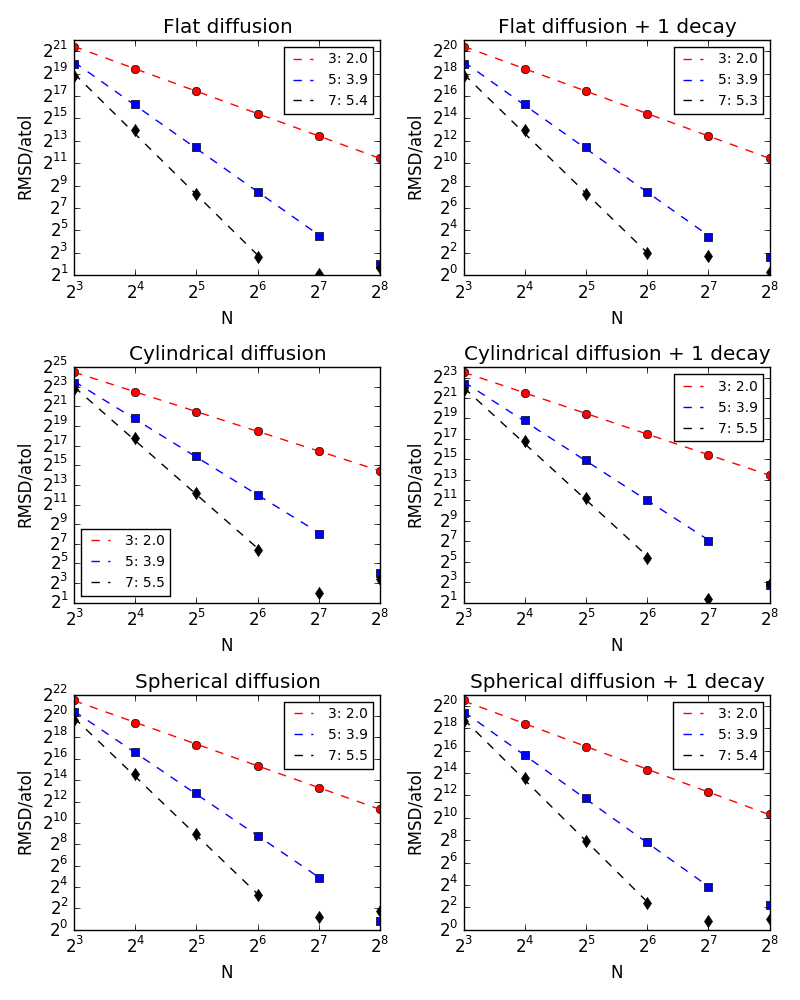
Analytic error scaling vs. number of bins
examples/analytic_N_scaling.py plots the error in the solution as function of number of bins. We expect different behaviour depending on the number of stencil points used. (N**-2, N**-4 and N**-6 for 3, 5 and 7 stencil points respectively)
$ python analytic_N_scaling.py --help
usage: analytic_N_scaling.py [-h] [-p] [-s SAVEFIG] [--nNs NNS] [-N NS]
                             [-r RATES] [--nfit NFIT]

optional arguments:
  -h, --help            show this help message and exit
  -p, --plot            False
  -s SAVEFIG, --savefig SAVEFIG
                        u'None'
  --nNs NNS             7
  -N NS, --Ns NS        -
  -r RATES, --rates RATES
                        u'0,0.1'
  --nfit NFIT           u'7,5,4'
Here is an example generated by:
$ python analytic_N_scaling.py --nNs 6 --plot --savefig analytic_N_scaling.png